2. Physics of light
Light is both an electromagnetic wave and a particle (photon) displacement. For computer graphics, the latter model is more often used; it is based on geometrical optics.
In simple scenes, the effects due to the wave theory of light are barely noticeable. With more complex materials, they may have a significant impact on the appearance. Most surfaces cause polarisation and light interferences. Polarisation influences inter-reflection between specular surfaces. Interferences produce rainbow effects when light penetrate thin layers or hit small irregularities or scratches.
In this chapter, we first introduce the physics used in computer graphics for describing light radiation. We explain the relationships between wave, frequency and wavelength. We expose how electric field and magnetic induction are linked together and described by Maxwell equations. We introduce radiometric units used in computer graphics. We expose some effects the wave theory of light has on appearance.
Finally, we introduce what is a reflectance with its wavelength dependency. In Chapter light transport, we further describe reflectance adding the angular dependency with Bidirectional Reflectance Distribution Function (BRDF).
Historical background
Historically, two interpretations of light have been competing. The first popular interpretation of light was the corpuscular theory proposed by René Descartes in 1637 [Descartes 1637], and further developed by Isaac Newton. The second interpretation was the wave front theory established by Christiaan Huygens presented in Traité de la Lumière [Huygens 2015].
Despite the comprehensive explanation of light transport provided by Huygens theory, corpuscular theory remained the consensual interpretation among scientists during the 17th century, mainly due to the fame of Descartes. It took a century before the wave theory appeared again thanks to Augustin Fresnel’s work [Fresnel 1866].
Still, the real nature of this wave was unknown. James Clerk Maxwell provided the answer in 1864 with his work on electromagnetic waves [Maxwell 1865].
The corpuscular theory was getting less attention until the beginning of 20th century with quantum theory. To explain black body radiations, Max Planck [Planck 1901] suggested light could gain or lose finite quanta of energy depending on wavelength. Albert Einstein used this idea in his first article on quantum physics in 1905 [Einstein 1905a], [1905b]. In 1924, de Broglie [De Broglie 1924] proposed the matter-wave theory extending the light corpuscular-wave duality.
The dual interpretation of light is now consensual. Light is both a photon displacement with finite energy states (electron volt1) and an electromagnetic wave propagation. It was experimentally shown by Tsuchiya [Tsuchiya et al. 1986] with photon-counting imaging device using the Young’s dual slits experiment.
Frequency and wavelength
Electromagnetic waves can take various frequencies \(\nu\), or wavelengths \(\lambda\). The wavelength \(\lambda\) characterise the distance between two repetitive patterns of the wave (see Figure 1. Light is a subset of electromagnetic waves to which our eyes are sensitive (see Figure 2. The wavelength of light characterises its colour. This will be discussed in Chapter 3.

Wavelengths and frequencies are linked by equation \eqref{eqn:wl_freq}.
\[\begin{equation} \lambda = \frac{v}{\nu} \qquad [\mathrm{m}] \label{eqn:wl_freq} \end{equation}\]Where:
- \(\lambda\) is the wavelength in meters [\(\mathrm{m}\)].}
- \(v\) is the speed of the wave in the considered medium in meters per seconds [\(\mathrm{m.s}^{-1}\)].
- \(\nu\) is the wave frequency in Hertz [\(\mathrm{Hz}\)] i.e. [\(\mathrm{s}^{-1}\)].}
Notice from equation \eqref{eqn:wl_freq}, a wavelength is dependent of speed of propagation for the medium the wave is travelling in. Intuitively, if a wave travels slower in a medium, the repeating oscillation patterns will be closer to each other, and the wavelength will then be shorter. When designating wavelengths for light, we are referring to their wavelength in a vacuum, i.e. for travelling speed of about \(3.10^8\: \mathrm{m.s}^{-1}\).
Mathematical description
All waves, not only electromagnetic waves, are described by the following equation:
\[\begin{aligned} \mathbf{\Psi} (\mathbf{r}, t) &= \mathbf{A}_0 \cos(\mathbf{k}\cdot \mathbf{r} - \omega t + \varphi_0)\\ \text{Or in its complex form: } \mathbf{\Psi} (\mathbf{r}, t) &= \mathbf{A}_0 \mathrm{e}^{i \left(\mathbf{k}\cdot \mathbf{r} - \omega t + \varphi_0\right)} \end{aligned}\]Where:
- \(\mathbf{r}\) is the position in space of three components \((x, y, z)\), with \(\|\mathbf{r}\|\) in [\(\mathrm{m}\)].
- \(t\) is the time [\(\mathrm{s}\)].
- \(\mathbf{A}_0\) is the amplitude. It describes the maximum value a waveform can take. For an electric field it is expressed in Volt per meter [\(\mathrm{V}\cdot\mathrm{m}^{-1}\)].}
- \(\mathbf{k}\) is the wave-number of three components \((k_x, k_y, k_z)\) with \(\| \mathbf{r} \|\) in [\(\mathrm{rad}\cdot\mathrm{m}^{-1}\)]. It describes the number of oscillations per distance unit.
- \(\omega\) is the wave pulsation, or angular frequency [\(\mathrm{rad}\cdot\mathrm{s}^{-1}\)]. It describes the phase shift per time unit.
- \(\varphi_0\) is the phase shift [\(\mathrm{rad}\)]. It describes the de-synchronisation of the wave from a reference wave without retardance.
To simplify calculus the complex form is often used. We deduce the physical solution from the real part.
The wave pulsation is proportional to the wave frequency:
\[\begin{aligned} \omega = 2\pi\nu \qquad [\mathrm{rad}\cdot\mathrm{s}^{-1}] \end{aligned}\]The wave-number vector is proportional to the wavelength, hence, to the frequency and the speed of the wave in the medium it is propagating in. In an isotropic medium, it is pointing to the same direction as the wave propagation direction. This is not the case for anisotropic media such as asymmetrical crystals.
\[\begin{aligned} \| \mathbf{k}\| = \frac{2\pi}{\lambda} \qquad [\mathrm{rad}\cdot\mathrm{m}^{-1}] \end{aligned}\]Hence, for an isotropic medium with a wave travelling in the \(\mathbf{z}\) direction:
\[\begin{aligned} \mathbf{k} &= \begin{bmatrix} 0 \\ 0 \\ k_z\end{bmatrix} = \begin{bmatrix} 0 \\ 0 \\ \frac{2\pi}{\lambda}\end{bmatrix} \qquad [\mathrm{rad}\cdot\mathrm{m}^{-1}] \end{aligned}\]For an electromagnetic field travelling in the \(\mathbf{z}\) direction, in an isotropic medium with no charge and no current, the electric field \(\mathbf{E}(\mathbf{r}, t)\) (in volts per meter [\(\mathrm{V.m^{-1}}\)]) and magnetic induction2 \(\mathbf{B}(\mathbf{r}, t)\) (in teslas [\(\mathrm{T}\)]) can be deduced from the Maxwell equations3:
\[\begin{aligned} \mathbf{\nabla} \cdot \mathbf{E} (\mathbf{r}, t) &= 0 & \mathbf{\nabla} \cdot \mathbf{B} (\mathbf{r}, t) &= 0\\ \mathbf{\nabla} \times \mathbf{E} (\mathbf{r}, t) &= -\frac{\partial \mathbf{B} (\mathbf{r}, t)}{\partial t} & \mathbf{\nabla} \times \mathbf{B} (\mathbf{r}, t) &= \mu_m \epsilon_m \frac{\partial \mathbf{E} (\mathbf{r}, t)}{\partial t} \end{aligned}\]Where:
- \(\epsilon_m\) is the permittivity of the medium in [\(\mathrm{F\cdot m^{-1}}\)].
- \(\mu_m\) is the permeability of the medium in [\(\mathrm{H\cdot m^{-1}}\)].
Poynting vector
To describe the energy flux of an electromagnetic wave, the Poynting vector \(\mathbf{S}\) is used. This is expressed in [\(\mathrm{W.m^{-2}}\)] and denoted \(\mathbf{S}\).
\[\begin{aligned} \mathbf{S}(\mathbf{r}, t) &= \mathbf{E}(\mathbf{r}, t) \times \mathbf{H}(\mathbf{r}, t) \qquad [\mathrm{W.m^{-2}}] \end{aligned}\]\(\mathbf{H}\) is the magnetic field intensity:
\[\begin{aligned} \mathbf{H}(\mathbf{r}, t) &= \frac{1}{\mu_0} \mathbf{B}(\mathbf{r}, t) - \mathbf{M}(\mathbf{r}, t) \qquad [\mathrm{A.m^{-1}}] \end{aligned}\]Where:
- \(\mu_o\) is the permeability of free space in [\(\mathrm{H\cdot m^{-1}}\)].
- \(\mathbf{M}\) is the magnetisation vector in [\(\mathrm{A.m^{-1}}\)].
In the following of this manuscript, we are considering wave travelling in an isotropic medium with no charge and no current with \(\mathbf{M}\) such as \(\mathbf{B} = \mu_m \mathbf{H}\)4.
Radiometry
| Quantity | Notation | Units |
|---|---|---|
| radiant flux | \(\Phi_e\) | [\(\mathrm{W}\)] |
| irradiance | \(E_e\) | [\(\mathrm{W.m^{-2}}\)] |
| radiant intensity | \(I_e\) | [\(\mathrm{W.sr^{-1}}\)] |
| radiance | \(L_e\) | [\(\mathrm{W.m^{-2}.sr^{-1}}\)] |
To measure physical quantities transported by an electromagnetic wave, we use radiometric quantities (see table above). Those are time average values. They do not describe the waveform of the electromagnetic radiation. The unit described in this section are for a whole spectrum or for a specific bandwidth. They shall be given along with the considered bandwidth. Spectral variant of those quantities gives the value for a specific wavelength (per meters or more conveniently, for light, per manometer), or frequency (per hertz).
Radiant flux
The radiant flux \(\Phi_e\) is the flow of radiant energy \(Q_e\) passing by unit of time. It is expressed in Joule per seconds [\(\mathrm{J.s}^{-1}\)] i.e. in Watts [\(\mathrm{W}\)]:
\[\begin{aligned} \Phi_e = \frac{\partial Q_e}{\partial t} \qquad [\mathrm{W}] \end{aligned}\]Irradiance
The irradiance is the radiant flux per unit area. This is the density of power for a given surface area \(A\) (in square meters \(\mathrm{m}^2\)). It is expressed in Watt per square meters [\(\mathrm{W.m^{-2}}\)]:
\[\begin{aligned} E_e(\vec p) = \frac{\partial \Phi_e}{\partial A} \qquad [\mathrm{W.m^{-2}}] \end{aligned}\]Irradiance is the time average of the Poynting vector:
\[\begin{aligned} E_e(\vec p) = <\|\mathbf{S}\|> \cos \theta \qquad [\mathrm{W.m^{-2}}] \end{aligned}\]Where:
- \(\theta\) is the angle between the Poynting vector (i.e. \(\mathbf{E} \times \mathbf{H}\)) and the surface element normal.
Then, given the electric field amplitude, the irradiance in the plane of incidence of the wave is:
\[\begin{equation} \label{eqn:irradiance_time_average} E_e(\vec p) = \frac{1}{2} \sqrt{\frac{\epsilon_m}{\mu_m}} \|\mathbf{E}_0\|^2 \cos \theta \qquad [\mathrm{W.m^{-2}}] \end{equation}\]Where:
- \(\epsilon_m\) is the electrical permittivity of the medium in [\(\mathrm{F.m}^{-1}\)].}
- \(\mu_m\) is the magnetic permeability of the medium in [\(\mathrm{H.m}^{-1}\)].}
- \(\mathbf{E}_0\) is the amplitude \(\mathbf{E}_0 = (E_x, E_y, 0)\) of the electric field, \(\|\mathbf{E}_o\|\) in [\(\mathrm{V}\cdot\mathrm{m}^{-1}\)]}
Radiant intensity
The radiant intensity \(I_e\) is the radiant flux per unit of solid angle. A solid angle is a measurement determining the coverage of a spherical cap for a unit sphere (\(\omega\) unit steradians \(\mathrm{sr}\)). It is expressed in watt per steradian [\(\mathrm{W.sr^{-1}}\)].
\[\begin{aligned} I_e(\omega) = \frac{\partial \Phi_e}{\partial \omega} \qquad [\mathrm{W.sr^{-1}}] \end{aligned}\]Radiance
The radiance \(L_e\) is the radiant flux per unit area per unit of solid angle. It is expressed in watt per square meter per steradian [\(\mathrm{W.m^{-2}.sr^{-1}}\)].
\[\begin{aligned} L_e(\omega, \vec p) = \frac{\partial I_e(\omega)}{\partial A_\bot} = \frac{\partial^2 \Phi_e}{\partial A_\bot \partial \omega} = \frac{\partial^2 \Phi_e}{\cos \theta \partial A \partial \omega} \qquad [\mathrm{W.m^{-2}.sr^{-1}}] \end{aligned}\]

Reciprocally, we can deduce irradiance from the radiance: it corresponds to the irradiance coming from all directions (see Figure 3):
\[\begin{aligned} E_e(\vec p) = \int_\Omega L_e(\omega, \vec p) \cos \theta \,\mathrm{d} \omega \qquad [\mathrm{W.m}^{-2}] \end{aligned}\]Similarly, for the radiant flux:
\[\begin{aligned} \Phi_e = \int_A \int_\Omega L_e(\omega, \vec p) \cos \theta \,\mathrm{d} \omega \,\mathrm{d} A \qquad [\mathrm{W}] \end{aligned}\]Radiance and irradiance are important in computer graphics. Radiance is the quantity which is perceived by our eyes or by a camera sensor. In Chapter light transport, we use the differential ratio between exiting radiance and incident irradiance on a surface to define the bidirection reflectance distribution function (BRDF).
Spectral power distribution
The previously presented photometric quantities are defined for the whole spectrum (a range of frequencies or wavelengths). For computer graphics, it is necessary to characterise the radiometric quantities for a given frequency or wavelength in order to translate those quantities into colours later on. The corresponding photometric units can be derived per unit of wavelength \(\lambda\) or frequency \(\nu\).
The spectral radiance:
\[\begin{aligned} L_e(\omega, \vec p, \lambda) = \frac{\partial^3 \Phi_e}{\partial A_\bot \partial \omega \partial \lambda} = \frac{\partial L_e(\omega, \vec p)}{\partial \lambda} \qquad [\mathrm{W.m^{-3}.sr^{-1}}] \end{aligned}\]The spectral irradiance:
\[\begin{aligned} E_e(\vec p, \lambda) = \frac{\partial^2 \Phi_e}{\partial A \partial \lambda} = \frac{\partial E_e(\vec p)}{\partial \lambda} \qquad [\mathrm{W.m^{-3}}] \end{aligned}\]A spectral power distribution (SPD) describes the value of spectral irradiance \(E_e(\vec p, \lambda)\) for a range of frequencies. It is usually more convenient to express the wavelength of light in manometer [\(\mathrm{nm}\)] i.e. [\(10^{-9}\:\mathrm{m}\)] so the spectral irradiance in [\(\mathrm{W.m^{-2}.nm^{-1}}\)].
A relative SPD is a normalised SPD relative to the spectral irradiance at a given wavelength, often unity or \(100\%\) at \(\lambda_0 = 560\:\mathrm{nm}\).
\[\begin{aligned} E_{e_{rel}}(\vec p, \lambda) = \frac{E_e(\vec p, \lambda)}{E_e(\vec p, \lambda_0)} \end{aligned}\]Figure 4 shows an example of the relative SPD of CIE (Commission Internationnale de l’Éclairage) D65 illuminant. An illuminant is a standardised light emission relative SPD.
Interferences
In this section and the following, we describe several phenomena related to the wave nature of light. They are not always visible but it is useful to know they exist and keep them in mind.
Wave superposition


The superposition of two waves of the same frequency is a wave of the same frequency:
\[\begin{eqnarray} \mathbf{\Psi} &=& A_1 \cos(\omega t + \varphi_1) + A_2 \cos(\omega t + \varphi_2)\\ &=& \frac{A_1}{2}\left[\mathrm{e}^{i (\omega t + \varphi_1)} + \mathrm{e}^{-i (\omega t + \varphi_1)} \right] + \frac{A_2}{2} \left[ \mathrm{e}^{i (\omega t + \varphi_2)} + \mathrm{e}^{-i (\omega t + \varphi_2)} \right] \nonumber\\ &=& \frac{1}{2}\left[ \mathrm{e}^{i \omega t} \left( A_1\mathrm{e}^{i \varphi_1} + A_2\mathrm{e}^{i \varphi_2} \right) + \mathrm{e}^{-i \omega t} \left( A_1\mathrm{e}^{-i \varphi_1} + A_2\mathrm{e}^{-i \varphi_2} \right) \right]\nonumber\\ \text{let } A_3\mathrm{e}^{i\varphi_3} &=& A_1\mathrm{e}^{i \varphi_1} + A_2\mathrm{e}^{i \varphi_2}\label{eqn:fresnel_vector}\\ &=& \frac{1}{2}\left[ \mathrm{e}^{i \omega t} A_3\mathrm{e}^{i\varphi_3} + \mathrm{e}^{-i \omega t} A_3\mathrm{e}^{-i\varphi_3} \right]\nonumber\\ &=& \frac{A_3}{2}\left[ \mathrm{e}^{i (\omega t +\varphi_3)} + \mathrm{e}^{-i (\omega t + \varphi_3)} \right]\nonumber\\ &=& A_3 \cos(\omega t + \varphi_3) \label{eqn:result_superpose} \end{eqnarray}\]The resulting wave (equation above) have a different amplitude \(A_3\) and phase \(\varphi_3\). So, when two waves of the same frequency cross or superpose each other, this causes interferences. The superposition of two waves can yield in the extreme cases of a resulting wave of null amplitude (destructive interference) or a wave with a double amplitude (constructive interference).
The phase difference from one to the other defines how they are going to interfere (see Figure 5).
To compute the resulting amplitude \(A_3\) and phase \(\varphi_3\), we can use Fresnel vectors.

Equation \eqref{eqn:fresnel_vector} shows the resulting phase and amplitude can be deduced from the sum of two complex numbers. This is equivalent to addition of two vector in the complex plane, one of magnitude \(A_1\) and phase \(\varphi_1\), the other with magnitude \(A_2\) and phase \(\varphi_2\). Those are the Fresnel vectors corresponding to the two superposed waves. The module of resulting vector will be \(A_3\) and its argument \(\varphi_3\) (see Figure 6).
Optical path length
Given a wave \(\mathbf{\Psi}\) of wavelength \(\lambda\) and phase shift \(\varphi\) at point \(\mathbf{O}\), travelling at speed \(c\) in the considered medium. Its phase shift \(\varphi'\) at point \(\vec T\) of distance \(l\) from \(\mathbf{O}\), will be:
\[\begin{aligned} \mathbf{\Psi}(\mathbf{O}) &= A \cos(2\pi \cdot \frac{c}{\lambda} \cdot t + \varphi)\nonumber\\ \mathbf{\Psi}(\vec T) &= A \cos(2\pi \cdot \frac{c}{\lambda} \cdot t + \varphi')\nonumber\\ &= A \cos(2\pi \cdot \frac{c}{\lambda} \cdot (t + \Delta t) + \varphi)\nonumber\\ \Delta t &= \frac{l}{c} \nonumber\\ \mathbf{\Psi}(\vec T) &= A \cos(2\pi \cdot \frac{c}{\lambda} \cdot t + \frac{2\pi}{\lambda} \cdot l + \varphi) \nonumber\\ \varphi' &= \frac{2\pi}{\lambda} \cdot l + \varphi \end{aligned}\]From the optical path length \(l\) (OPL) we get the relative shift of a wave: \(\delta = \frac{2\pi}{\lambda} \cdot l\).
Interference patterns
Figure 7 shows two waves \(\mathbf{\Psi}_1, \mathbf{\Psi}_2\) of same wavelength \(\lambda\) with phase shifts \(\varphi_1, \varphi_2\) at position \(\mathbf{P_1}, \mathbf{P_2}\). They cross at \(\mathbf{P_3}\) at distances \(l_1, l_2\) respectively from \(\mathbf{P_1}, \mathbf{P_2}\). The resulting wave \(\mathbf{\Psi}_3\) at \(\mathbf{P_3}\) will be the result of the interference between \(\mathbf{\Psi}_1\) and \(\mathbf{\Psi}_2\). To get the resulting wave \(\mathbf{\Psi}_3\), we are interested in knowing respective phases \(\varphi'_1, \varphi'_2\) of \(\mathbf{\Psi}_1, \mathbf{\Psi}_2\) at \(\mathbf{P_3}\).

Given the optical path lengths \(l_1, l_2\), we can deduce the superposition of \(\mathbf{\Psi}_1\) and \(\mathbf{\Psi}_2\) at \(\mathbf{P_3}\):
\[\begin{aligned} \mathbf{\Psi}_3 &= A \left[ \cos(\omega t + \varphi'_1) + \cos(\omega t + \varphi'_2) \right]\\ &= A \left[ \cos(\omega t + (\delta_1 + \varphi_1)) + \cos(\omega t + (\delta_2 + \varphi_2)) \right]\\ &= 2A \cos\left( \frac{\delta_1 - \delta_2}{2} \frac{\varphi_1 - \varphi_2}{2} \right) \cos\left(\omega t + \frac{\delta_1 + \delta_2}{2} \frac{\varphi_1 + \varphi_2}{2} \right) \end{aligned}\]Notice the amplitude variation in space is dependent of the wavelength. This means, the constructive and destructive interferences occurs at a different spatial frequency depending on the wavelength. The second cosine term is time dependant and not influencing the appearance of the interference pattern: the irradiance is the time-average of the resulting wave. So, the optical path difference \(l_1 - l_2\) determines the wave amplitude and irradiance at \(\mathbf{P_3}\).
In practice, this leads to the observation of rainbow patterns with interferences and polychromatic light. Fresnel’s vectors can be used if having to consider waves of different amplitude or for accumulating results from a path tracer (see Figure 8).
While the superposition of waves is linear, the resulting irradiance is proportional to the square of the wave amplitude (see equation \eqref{eqn:irradiance_time_average}).
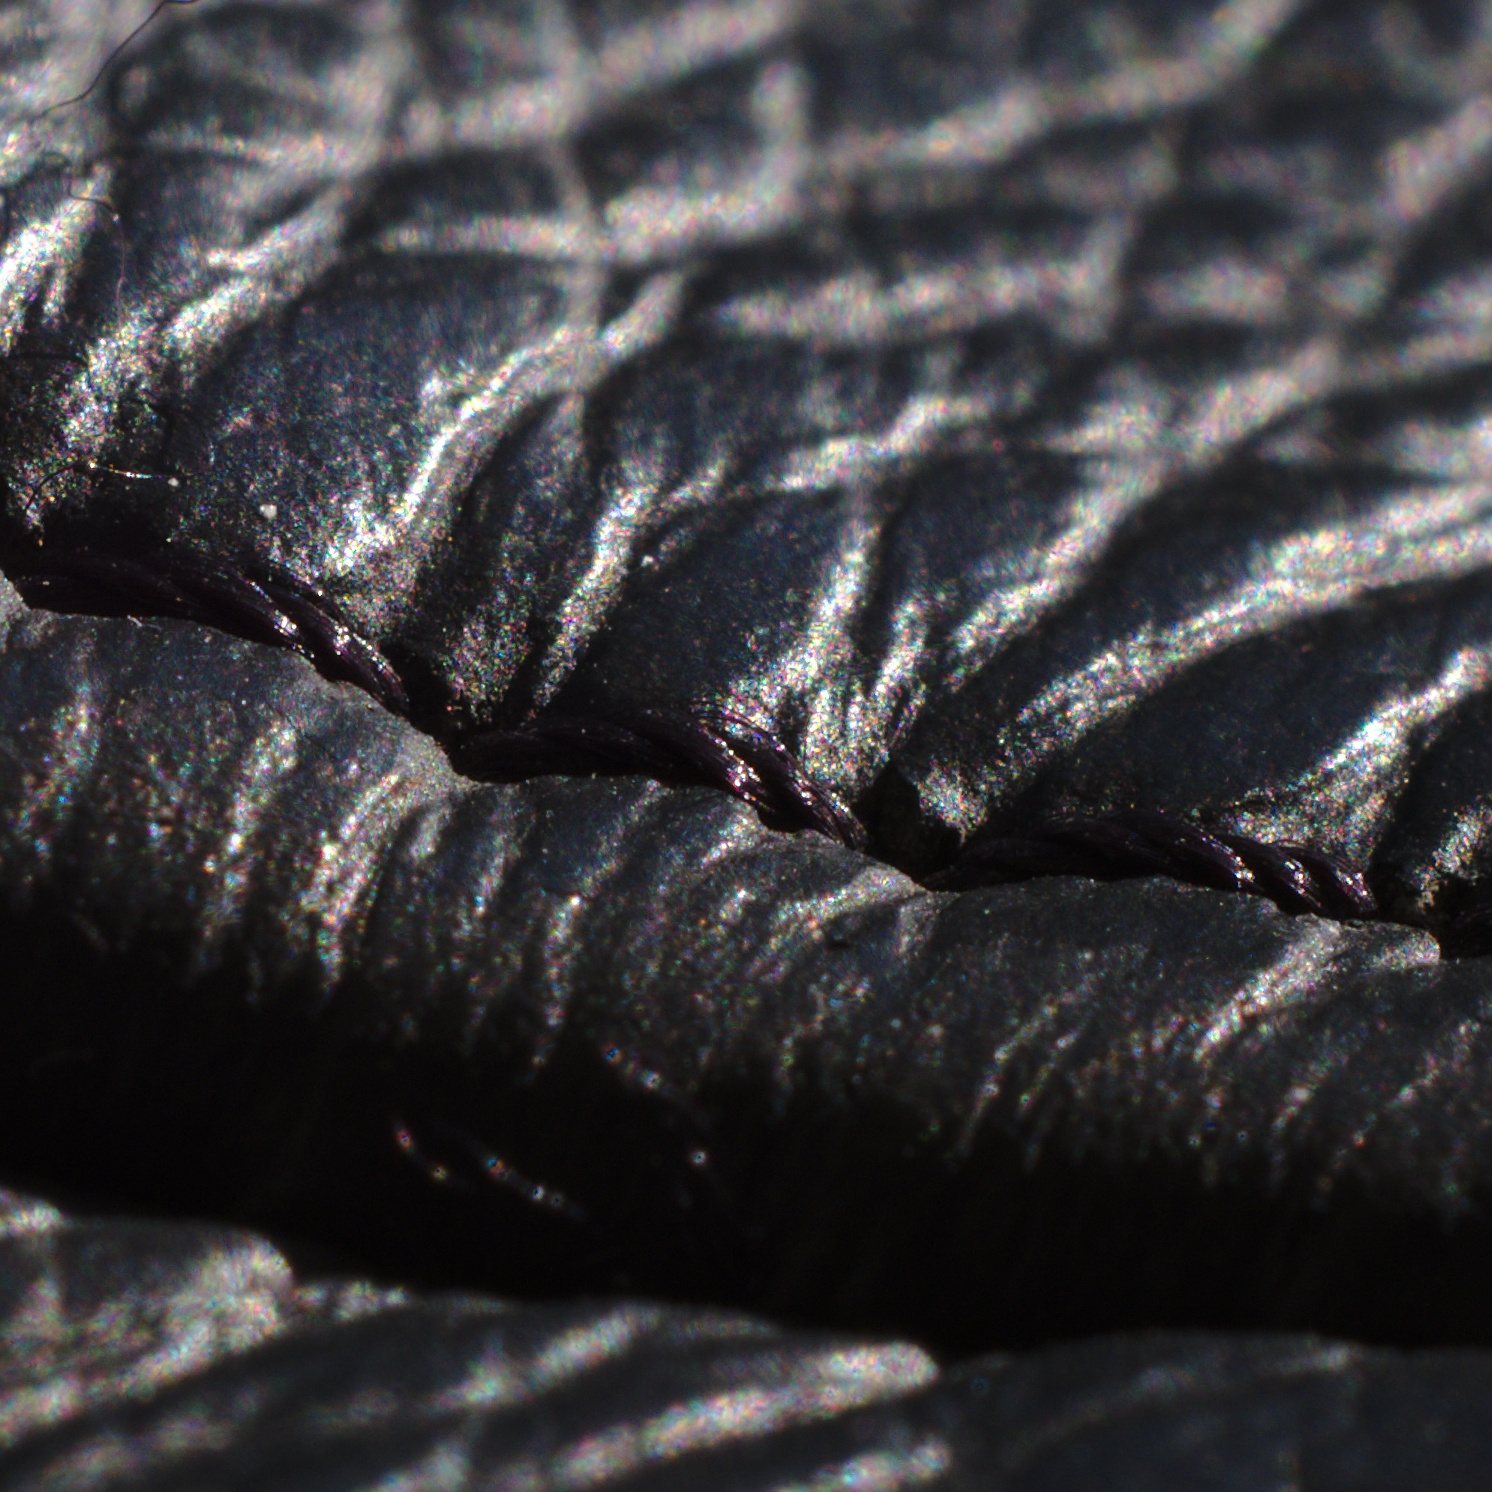
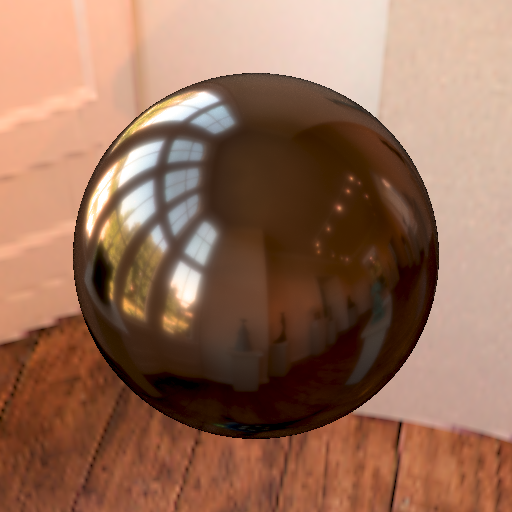
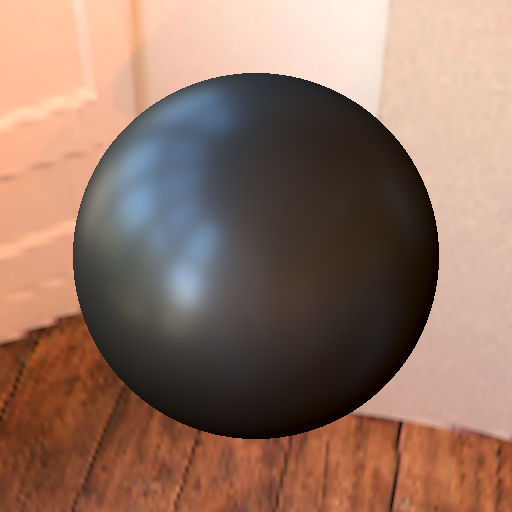
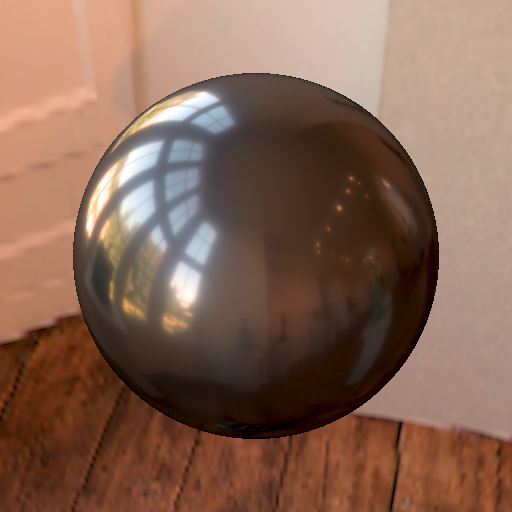
Interferences are observable at macro-scale (see Figure 9). For instance, surfaces whose thickness is in the order of magnitude of wavelength of light (soap bubble, anti-glare coating, leather conditioners…) create visible rainbow effects due to interferences. Microstructure also cause interferences (small scratches on metals, tiny bumps on some plastics…). Those phenomena are due to light path interfering with itself causing coloured reflection even with incoherent light.
Interferences also occur when light hits a surface with irregularities at the scale of the wavelength. Holzschuch and Pacanowski [Holzschuch and Pacanowski 2017] proven the need for taking interferences into account and proposed a model to handle those phenomena (see Figure 10). Belcour and Barla [Belcour and Barla 2017] proposed a model to handle iridescent effects caused by thin-films.


Polarisation
We have considered the electric field oscillating in one plane in the previous examples. In equation \eqref{eqn:electric_field}, the electric field was presented in a more complete form. Its amplitude and shift may differ for \(\mathbf{x}\) and \(\mathbf{y}\) axis when propagating in \(\mathbf{z}\) direction. The plane where the electric field propagates may rotate over time. This defines the polarisation of the wave.
Polarisation states


When the plane where the electric field propagates remains fixed, the light is said linearly polarised. If the plane rotates over time at the same frequency as the wave frequency, the light is said to be circularly polarised. The intermediate states are said elliptically polarised. Finally, if this plane rotates randomly the light is said to be unpolarised.
Figure 11 illustrates different states of polarisation. The electric field \(\mathbf{E}\) propagates along the \(\mathbf{z}\) axis and is projected on \(\mathbf{x}\) and \(\mathbf{y}\). It is defined as:
\[\begin{aligned} \mathbf{E} (t) &= E_x(t) \cdot \mathbf{x} + E_y(t) \cdot \mathbf{y} \qquad [\mathrm{V.m^{-1}}] \end{aligned}\]Where \(E_x(t)\) and \(E_y(t)\) are the electric field components with respect to \(\mathbf{x}\) and \(\mathbf{y}\) directions.
We cannot measure the value of \(\mathbf{E} (t)\) but only its time-averaged value, corresponding to the irradiance \(E_e\) (see equation \eqref{eqn:irradiance_time_average}).
While our eyes are almost not sensitive to the polarisation of light5, light transport is: surfaces can reflect or transmit the light differently depending on the polarisation state of the incoming radiation. The resulting energy received by our eyes is then impacted. It is necessary to consider polarisation for light transport interactions in computer graphics.
Stokes formalism
To represent polarisation states, various mathematical formalisms exists. We use the Stokes vector formalism, adopted in computer graphics:
\[\begin{aligned} \mathbf{S} = \begin{pmatrix} S_0 \\ S_1 \\ S_2 \\ S_3 \end{pmatrix} = \begin{pmatrix} I \\ Q \\ U \\ V \end{pmatrix} \end{aligned}\]The same wave can be represented as different combination of sinusoidal waves on an orthogonal basis depending on the frame orientation. So, this vector6 is defined within a specific frame.
Linear polarisation
We can measure the irradiance but not directly the variation of electric field over time. With two linear polarisation filters, one aligned in \(\mathbf{x}\) direction and the other with \(\mathbf{y}\), we can measure \(E_{e_x}\) and \(E_{e_y}\), the irradiance components on \(\mathbf{x}\) and \(\mathbf{y}\).
The Stokes’ parameter \(Q\) is defined as follows:
\[\begin{aligned} Q = E_{e_x} - E_{e_y} \qquad [\mathrm{W.m^{-2}}] \end{aligned}\]When the linearly polarised wave is rotated, the polarisation axis cannot be determined solely with \(Q\): two solutions are possible.
To leverage this indetermination, we use the third Stokes’ parameter \(U\). It consists in rotating the \((\mathbf{O}, \mathbf{x}, \mathbf{y})\) frame by \(45^{\circ}\). We are calling this new frame \((\mathbf{O}, \vec a, \mathbf{B})\). Then, the irradiance components are measured in this new frame (see Figure 12):
\[\begin{equation} U = E_{e_a} - E_{e_b} \qquad [\mathrm{W.m^{-2}}] \end{equation}\]Circular polarisation
Figures 3 and 4 illustrate the case where the electric field is rotating over time leading to circular or elliptical polarisation.


We get \(E_{e_l}\) and \(E_{e_r}\), the irradiance of left and right polarisation with combination of a quarter-wave filter and a linear polarisation filter. A quarter-wave filter introduces a phase shift of \(\frac{\pi}{2}\) on one axis of the electric field. Depending on the rotation direction of the polarisation plane, it transforms circular into linear polarised wave rotated by \(45^\circ\) or \(-45^\circ\) (see Figure 13).
The fourth Stokes’ parameter \(V\) is defined as:
\[\begin{aligned} V = E_{e_r} - E_{e_l} \qquad [\mathrm{W.m^{-2}}] \end{aligned}\]We have to use and specify a convention for the orientation of the circular polarisation. Here, we are in the frame facing the propagation direction of the wave.
Irradiance and degree of polarisation
The first component \(I\) of the Stokes’ vector is the irradiance. We can represent any polarisation state by Stoke’ vectors: a randomly polarised light will have its \(Q, U, V\) components null. But irradiance information will remained characterised by its \(I\) component.
The ratio between norm of vector defining polarisation \((Q, U, V)\), \((Q, U)\) or \(V\) and irradiance \(I\) is the degrees of polarisation (see Table below).
| Degree of polarisation | Degree of linear polarisation | Degree of circular polarisation |
|---|---|---|
| \(DoP = 100 \cdot \frac{\sqrt{Q^2+U^2+V^2}}{I}\) | \(DoLP = 100 \cdot \frac{\sqrt{Q^2+U^2}}{I}\) | \(DoCP = 100 \cdot \frac{V}{I}\) |
Reflectance
When light interacts with matter, it is scattered. The energy is not scattered equally depending on the wavelength and the direction of the incoming wave. We will discuss in Chapter light transport the directional dependency.
Reflectance is the effectiveness of a surface to reflect radiant energy. It is a function of wavelength.
Spectral reflectance
In the simpler scenario, when light illuminate a surface, the reflected radiation will be at the same frequency as the incoming one. The reflectance can be described similarly as a spectral power distribution. For a given wavelength, the effectiveness of its reflection is given by a value.
Figure 14 shows an example of such reflectance spectrum from a measured material of the database of Dupuy and Jakob [Dupuy and Jakob 2018].
Bi-spectral reflectance
In addition to straight re-emission with the same wavelength, a material can, for certain exiting wavelengths re-emit at a longer wavelength. This phenomena is called fluorescence.

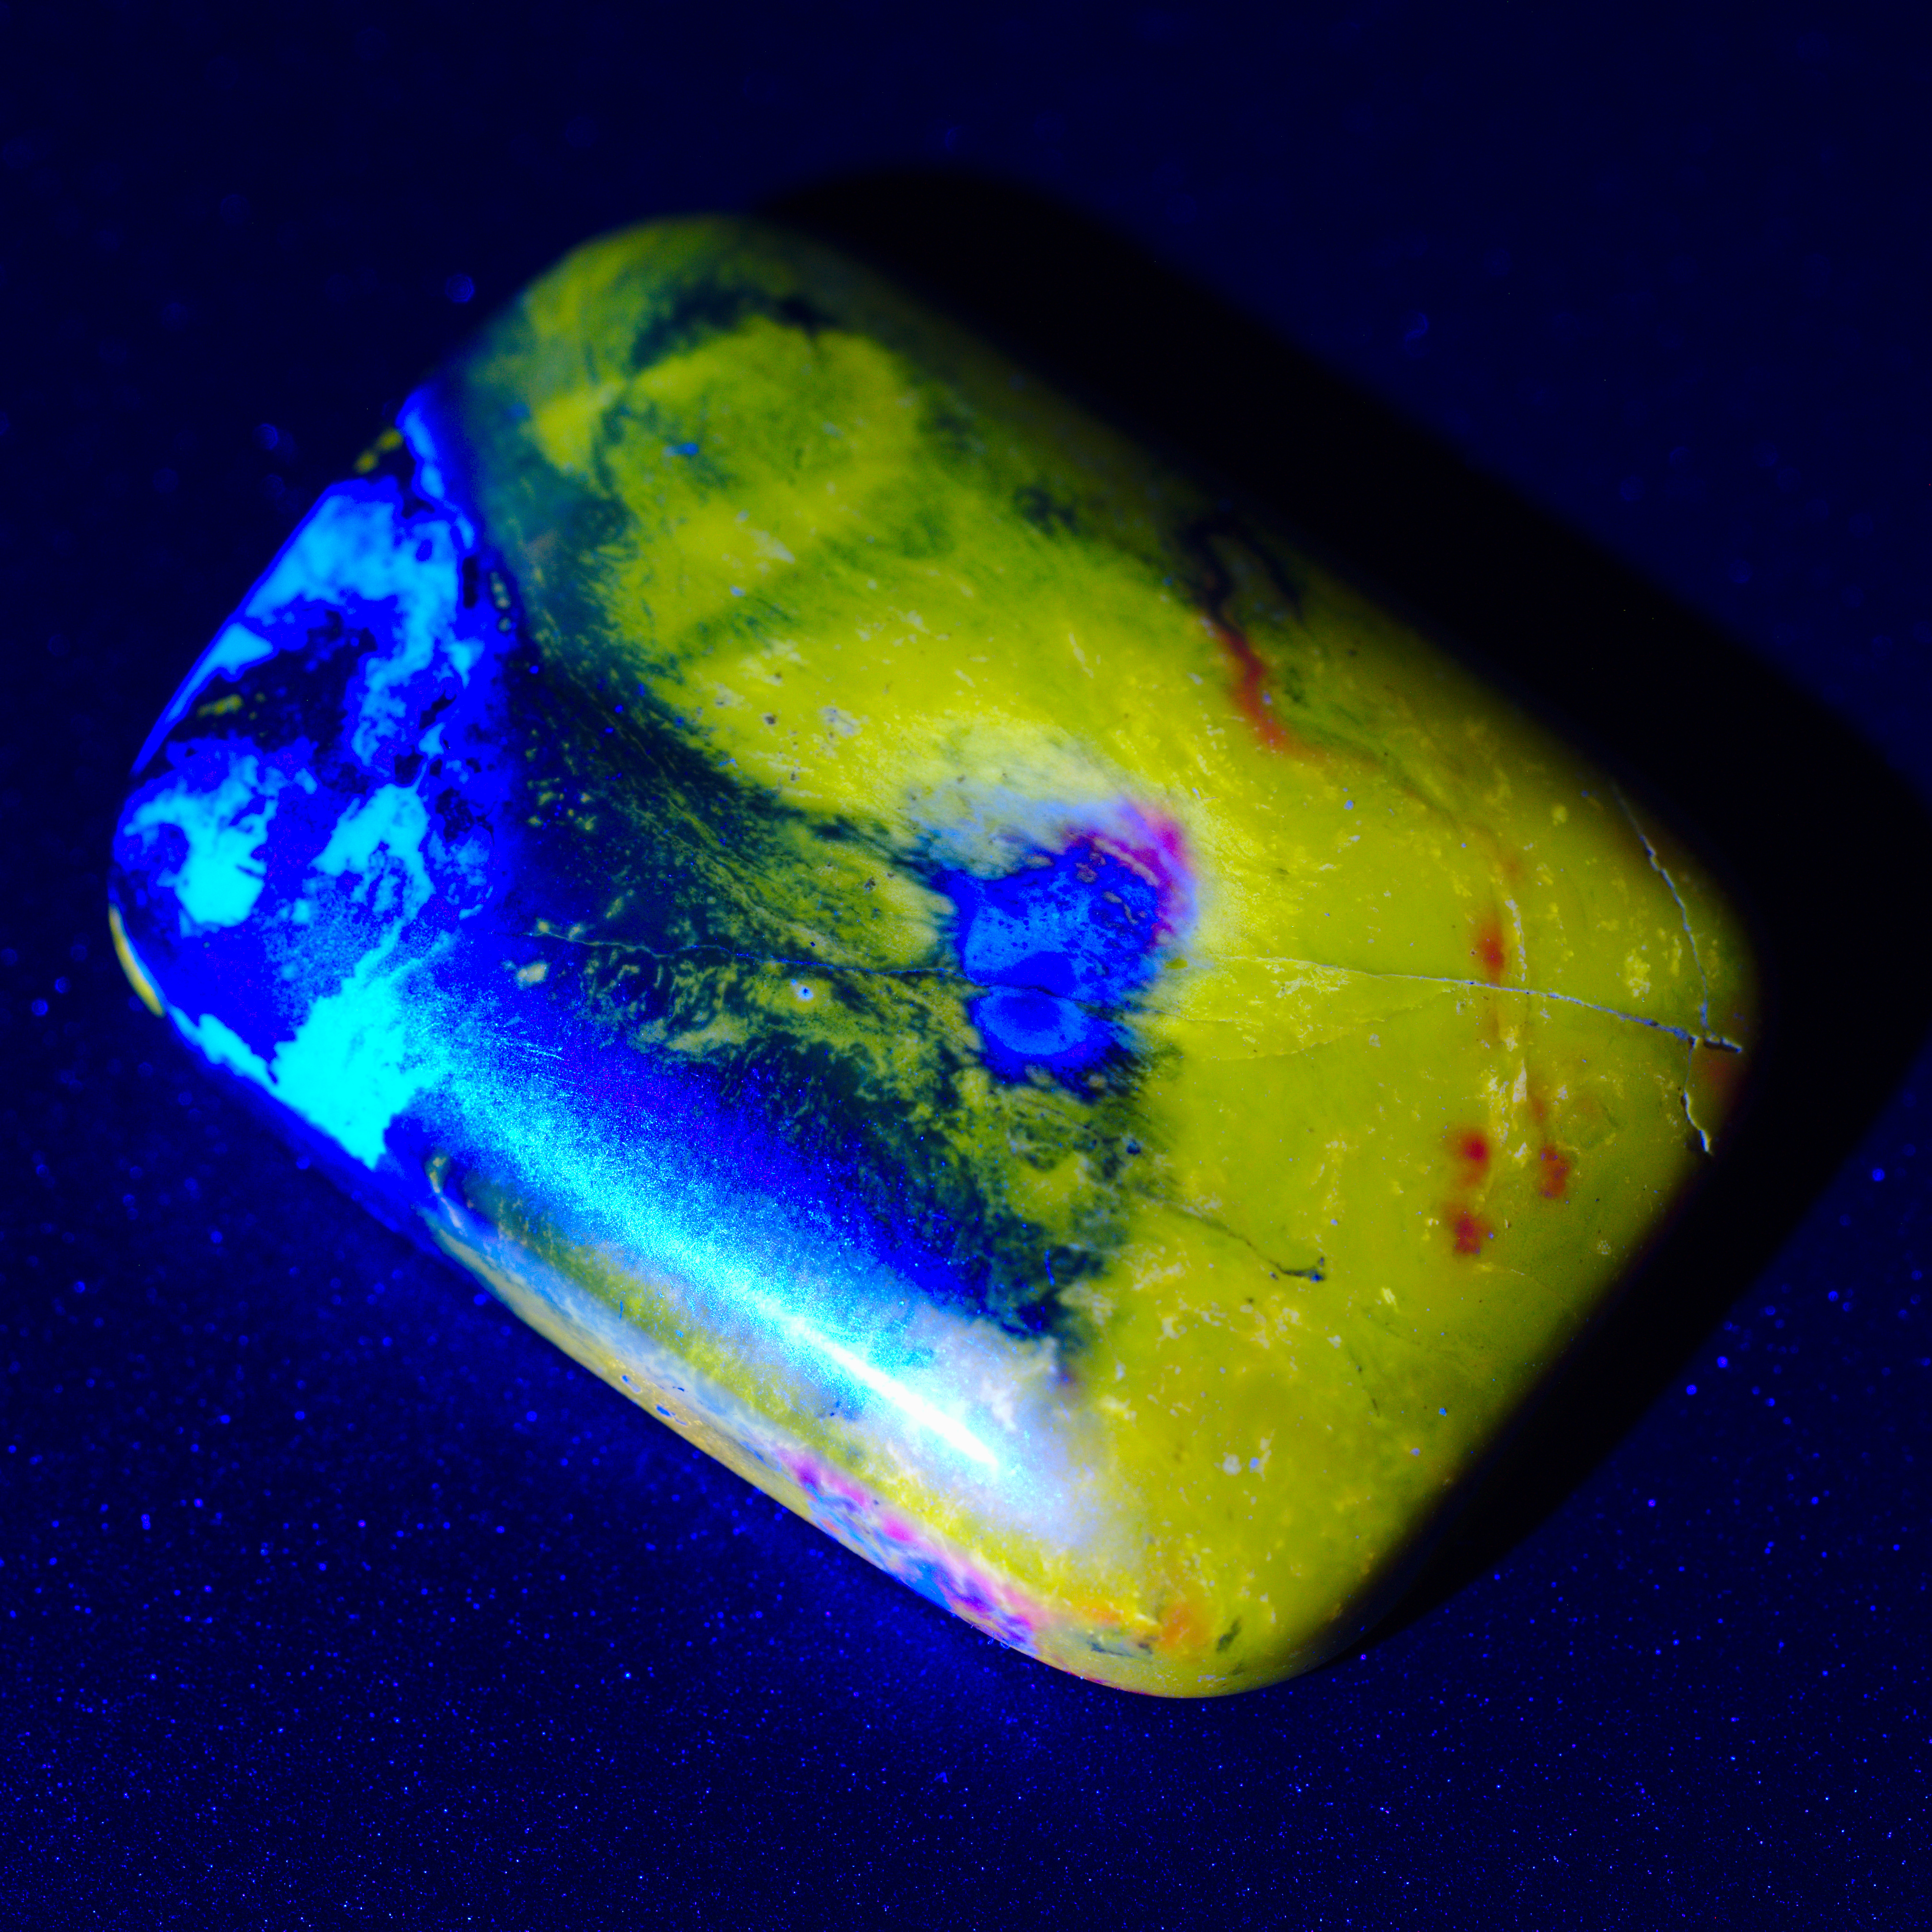

A molecule re-emits a previously absorbed photon in a lower energy state than the one it was absorbed in: this means the re-emitted light from a collision event with such a molecule has a longer wavelength than the original incoming light. This shift from the absorbed frequency to the re-emitted one is spread around a main frequency as shown in Figure 16. This is referred to as Stokes shift.
Such phenomena can be described by a fluorescence response function \(\Phi(\lambda_i, \lambda_o)\), which for an excitation wavelength \(\lambda_i\) returns the amount of energy relaxed to another re-emission wavelength \(\lambda_o\). For \(\lambda_i=\lambda_o\), this corresponds to the non-fluorescent reflectance introduced in the previous section.
Re-radiation matrix
The fluorescence response \(\Phi(\lambda_i, \lambda_o)\) can be represented in a discretised form as a so-called re-radiation matrix. An example dataset is shown in Figure 17. The incoming wavelength \(\lambda_i\) lies on its vertical axis, and the outgoing wavelength \(\lambda_o\) on its horizontal. The diagonal of such a re-radiation matrix describes the amount of light that does not undergo any wavelength shift.
Shifting probability
Kasha’s rule states that the re-emission spectrum distribution should be the same, whatever wavelength within the absorbing area of the spectrum is used for excitation. Only the intensity of this re-emitted spectrum is modified. However, this rule does not always apply – at least not in the strict sense.
While the accumulated energy absorption and re-emission, as show in Figure 16, represents, respectively, the sum of the columns and the lines of the re-radiation matrix, i.e. \(\int_\Lambda- \Phi(\lambda,\lambda_o)- \,\mathrm{d}\lambda_o\) and \(\int_\Lambda- \Phi(\lambda_i,\lambda)- \,\mathrm{d}\lambda_i\), the probability for a given wavelength to be the re-emitted may differ if the particle does not exactly follow Kasha’s rule (and as Figure 18 shows, such slight variations are actually the norm). Then, the distribution of possible re-emission wavelengths for an excitation wavelength \(j\) is given by the corresponding column \(j\) in the re-radiation matrix. On the other hand, from a re-emitted wavelength \(i\), the possible spectrum of excitation wavelengths is given by the corresponding line \(i\) in the matrix.
Conclusion
In this chapter, we have presented light as a wave. We introduced radiometric units useful in computer graphics. We insist on the importance of considering light as an electromagnetic wave through its spectral power distribution and its polarisation state. We have exposed some visual effects due to the wave nature of light.
In computer graphics, we mostly use geometrical optics for light transport. We can use specific mathematical frameworks to account for some of wave properties. For instance, Stokes’ vectors account for polarisation in geometrical optics. Local models also handle properties of the wave nature of light like interferences.
For global light transport, we generally ignore effects like diffraction, causing wavefront propagation in occluded areas. At the time of writing this thesis, they are hard to evaluate globally and induce a huge memory overhead with an increasing complexity. They generally does not impact significantly the final rendering, with wavelength we are working with.
We prefer to use local models to handle those complicated cases while providing a good approximations.
References
Belcour, Laurent, and Pascal Barla. 2017. “A Practical Extension to Microfacet Theory for the Modeling of Varying Iridescence.” ACM Trans. Graph. 36 (4): 65:1–65:14. https://doi.org/10.1145/3072959.3073620.
De Broglie, Louis. 1924. “Recherches sur la théorie des Quanta.” Theses, Migration - université en cours d’affectation. https://tel.archives-ouvertes.fr/tel-00006807.
Descartes, René. 1637. Discours de La Méthode Pour Bien Conduire Sa Raison et Chercher La Vérité Dans Les Sciences, Plus La Dioptrique, Les Météores et La Géométrie Qui Sont Des Essais de Cette Méthode. A Leyde de l’imprimerie de Jan Maire. https://gallica.bnf.fr/ark:/12148/btv1b86069594/.
Dupuy, Jonathan, and Wenzel Jakob. 2018. “An Adaptive Parameterization for Efficient Material Acquisition and Rendering.” Transactions on Graphics (Proceedings of SIGGRAPH Asia) 37 (6): 274:1–274:18. https://doi.org/10.1145/3272127.3275059.
Einstein, Albert. 1905a. “On a Heuristic Point of View about the Creation and Conversion of Light.” English Translation by Wikisource. English translation by Wikisource https://en.wikisource.org/?curid=59468.
Einstein, Albert. 1905b. “Über einen die Erzeugung und Verwandlung des Lichtes betreffenden heuristischen Gesichtspunkt.” Annalen Der Physik 322 (6): 132–48. https://doi.org/10.1002/andp.19053220607.
Fresnel, Augustin. 1866. Oeuvres Complètes d’Augustin Fresnel. Edited by Léonor Fresnel, Henri de Senarmont, and Émile Verdet. Paris: Impr. impériale. http://gallica.bnf.fr/ark:/12148/bpt6k1512245j.
Holzschuch, Nicolas, and Romain Pacanowski. 2017. “A Two-scale Microfacet Reflectance Model Combining Reflection and Diffraction.” ACM Transactions on Graphics 36 (4): 66:1–66:12. https://doi.org/10.1145/3072959.3073621.
Huygens, Christiaan. 2015. Traité de La Lumière. Paris: Dunod.
Maxwell, James Clerck. 1865. “VIII. A Dynamical Theory of the Electromagnetic Field.” Philosophical Transactions of the Royal Society of London 155 (January): 459–512. https://doi.org/10.1098/rstl.1865.0008.
Planck, Max. 1901. “Ueber Das Gesetz Der Energieverteilung Im Normalspectrum.” Annalen Der Physik 309 (3): 553–63. https://doi.org/10.1002/andp.19013090310.
Tsuchiya, Y., E. Inuzuka, T. Kurono, and M. Hosoda. 1986. “Photon-Counting Imaging and Its Application.” In Photo-Electronic Image Devices, Proceedings of the Eighth Symposium, 21–31. Elsevier. https://doi.org/10.1016/s0065-2539(08)61600-5.
-
1 eV (electron volt) is the amount of energy of a single infrared photon (\(\lambda = 1240\:\mathrm{nm}\)). ↩
-
We chose to call the B-field “magnetic induction”. It can be called “magnetic field” which is confusing: the H-field (in amperes per meter [\(\mathrm{A.m^{-1}}\)]) being also called “magnetic field” on some textbooks. The B-field may also be designed as “magnetic flux density”. The H-field may also be designed as the “magnetic field intensity” or “magnetic field strength”. ↩
-
This is a simplified form of Maxwell equations in the considered conditions. ↩
-
This often holds for diamagnetic and paramagnetic materials. ↩
-
The Haidinger’s brush is a noticeable example showing our eyes are slightly sensitive to polarisation. ↩
-
We use \(\mathbf{S}\) notation which is widely adopted in the literature. It shall not be confused with the previously introduced Poynting vector. ↩